Current ENSO status
El Niño
According to NOAA CPC ↗
Updated on 10 September 2026
El Niño Advisory
Relative Niño 3.4 anomalies Year comparison
1982199720152026 · latest
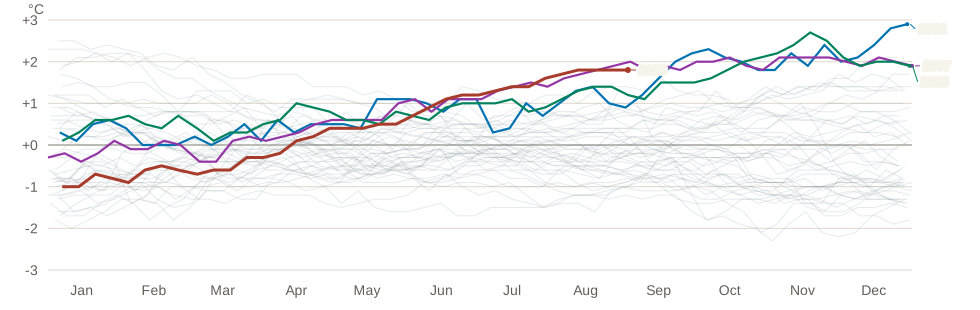
Sea surface temperature anomalies and ENSO indices
The Niño 3.4 index tracks sea surface temperature anomalies in the equatorial Pacific. Conventional anomalies show how much warmer or cooler the water is than the 1991–2020 average. Relative anomalies also account for temperature changes across the broader tropics. Use the chart to compare years or explore the full historical record.
The Relative Oceanic Niño Index (RONI) is a separate three-month index for Niño 3.4. The ENSO status above follows NOAA’s dated assessment of El Niño, La Niña or ENSO-neutral conditions; a single temperature reading does not determine the phase.
Read the guides to the Niño 3.4 index, the Relative Oceanic Niño Index, RONI versus ONI and the three ENSO phases.
Niño 3.4, RONI vs ONI and methodology →Historical ENSO data and sources
Relative weekly regions
Relative OISST v2.1 · 1991–2020 baseline.
9 September 1981 – 9 September 2026.
2,349 observations.
Conventional weekly regions
OISST v2.1 · 1991–2020 baseline.
2 September 1981 – 9 September 2026.
2,350 observations.
Seasonal RONI
Relative ERSST v6 · 1991–2020 baseline.
DJF 1950 – JJA 2026.
919 observations.